How Can D3.js Fulfill All Your Cartographic Desires
Who am I?
Maps and visualizations
are my passion!
D3.js
- Data Driven Documents
- JavaScript library for manipulating documents based on data
- Bridges the gap between static display of data, and interactive and animated data visualizations
- It uses JavaScript, CSS, HTML and SVG to manipulate a DOM
- Its strength is in its data visualization ability
What is D3 used for?
To integrate and animate different connected charts
For Maps
Let's Make a Map
Data
1. Get the Data
2. Prepare the Data
3. Code
    <!DOCTYPE html>
    <html>
      <head>
        <meta charset="utf-8">
        <title>D3 Hello World</title>
        <script src="https://d3js.org/d3.v3.min.js"></script>
      </head>
      <body>
        <script type="text/javascript">
          d3.select("body").append("p").text("Hello World");
        </script>
      </body>
    </html>
My first D3.js map
    <!DOCTYPE html>
    <html>
      <head>
        <meta charset="utf-8">
        <title>D3 World Map</title>
        <style>

          /* CSS goes here. */

        </style>
        <script src="https://d3js.org/d3.v3.min.js"></script>
        <script src="https://d3js.org/topojson.v1.min.js"></script>
      </head>
      <body>
        <script type="text/javascript">

          /* JavaScript goes here. */

        </script>
      </body>
    </html>
    <!DOCTYPE html>
    <html>
      <head>
        <meta charset="utf-8">
        <title>D3 World Map</title>
        <style>
          path {
            stroke: white;
            stroke-width: 0.5px;
            fill: black;
          }
        </style>
        <script src="https://d3js.org/d3.v3.min.js"></script>
        <script src="https://d3js.org/topojson.v0.min.js"></script>
      </head>
      <body>
        <script type="text/javascript">
          var width = 950;
          var height = 720;

          var projection = d3.geo.mercator();

          var svg = d3.select("body").append("svg")
              .attr("width", width)
              .attr("height", height);
          var path = d3.geo.path()
              .projection(projection);
          var g = svg.append("g");

          d3.json("world-110m2.json", function(error, topology) {
              g.selectAll("path")
                .data(topojson.object(topology, topology.objects.countries)
                    .geometries)
              .enter()
                .append("path")
                .attr("d", path)
          });
        </script>
      </body>
    </html>
Projections
  var projection = d3.geo.mercator();
  var path = d3.geo.path()
      .projection(projection);
- Geo Projections ... 12
- Extended Geographic Projections ... > 40
- Custom projections ... ∞
d3.geo.projectiond3.geo.projectionMutator
Let's Make a Second Map
index.html
    <!DOCTYPE html>
    <meta charset="utf-8">
    <style>

    path {
      stroke: white;
      stroke-width: 0.25px;
      fill: grey;
    }

    </style>
    <body>
    <script src="https://d3js.org/d3.v3.min.js"></script>
    <script>

    var width = 960,
        height = 600;

    var projection = d3.geo.mercator()
        .rotate([0, 0])
        .center([15, 46])
        .scale(4000)
        .translate([width / 2, height / 2])
        .precision(.1);

    var path = d3.geo.path()
        .projection(projection);

    var svg = d3.select("body").append("svg")
        .attr("width", width)
        .attr("height", height);

    var g = svg.append("g");

    d3.json("zup.json", function (error, topology) {
      g.selectAll("path")
          .data(topology.features)
          .enter()
          .append("path")
          .attr("d", path);
    });

    </script>
My second D3.js map with colors
    <script>
        d3.json("zup.json", function (error, topology) {
          g.selectAll("path")
              .data(topology.features)
              .enter()
              .append("path")
              .attr("class", function(d) { return "zup" + d.properties.SIFRA; })
              .attr("d", path);
        });
    </script>

    <style>
        path {
          stroke: #000;
          stroke-width: 0.5px;
        }
        .zup01, .zup08, .zup10, .zup12, .zup13, .zup19, .zup20 {
          fill: #7fc97f;
        }
        .zup02, .zup03, .zup14, .zup15, .zup18 {
          fill: #beaed4;
        }
        .zup04, .zup05, .zup07, .zup16 {
          fill: #fdc086;
        }
        .zup06, .zup09, .zup11, .zup17, .zup21 {
          fill: #ffff99;
        }
    </style>
My second D3.js map with colors
My second D3.js map with labels
    <script>
        d3.json("zup.json", function (error, topology) {
          g.selectAll("path")
              .data(topology.features)
              .enter()
              .append("path")
              .attr("class", function(d) { return "zup" + d.properties.SIFRA; })
              .attr("d", path);

          g.selectAll("labels")
              .data(topology.features)
              .enter()
              .append("text")
              .attr("class", "labels")
              .attr("transform", function(d) { return "translate(" + path.centroid(d) + ")"; })
              .attr("dy", ".35em")
              .text(function(d) { return d.properties.NAZIV; });
        });
    </script>

    <style>
        .labels {
          fill: #666;
          fill-opacity: .75;
          font-size: 8px;
          text-anchor: middle;
        }
    </style>
My second D3.js map with labels
My second D3.js map with tooltips
    <script>
        var tooltip = d3.select("body").append("div").attr("class", "tooltip");

        d3.json("zup.json", function (error, topology) {
          g.selectAll("path")
              .data(topology.features)
              .enter()
              .append("path")
              .attr("class", function(d) { return "zup zup" + d.properties.SIFRA; })
              .on("mouseover", function(d) {
                tooltip.html(d.properties.NAZIV);
              })
              .on("mouseout", function(d) {
                tooltip.html("");
              })
              .attr("d", path);
        });
    </script>

    <style>
        .zup {
          cursor: pointer;
        }
        .zup:hover {
          fill: #386cb0;
        }
        .tooltip {
          position: absolute;
          top: 10px;
          left: 10px;
        }
    </style>
My second D3.js map with tooltips
My final and interactive D3.js map
My final and interactive D3.js map
<!DOCTYPE html>
<meta charset="utf-8">
<style>

path {
  stroke: #000;
  stroke-width: 0.5px;
}
.background {
  fill: none;
  pointer-events: all;
}
.zup {
  cursor: pointer;
}
.zup:hover {
  fill: #386cb0;
}
.zup01, .zup08, .zup10, .zup12, .zup13, .zup19, .zup20 {
  fill: #7fc97f;
}
.zup02, .zup03, .zup14, .zup15, .zup18 {
  fill: #beaed4;
}
.zup04, .zup05, .zup07, .zup16 {
  fill: #fdc086;
}
.zup06, .zup09, .zup11, .zup17, .zup21 {
  fill: #ffff99;
}
.tooltip {
  position: absolute;
  top: 10px;
  left: 10px;
  background: #fff;
  padding: 5px;
}

</style>
<body>
<script src="https://d3js.org/d3.v3.min.js"></script>
<script>

var width = 960,
    height = 600,
    active = d3.select(null);

var projection = d3.geo.mercator()
    .rotate([0, 0])
    .center([15, 46])
    .scale(4000)
    .translate([width / 2.5, height / 7])
    .precision(.1);

var zoom = d3.behavior.zoom()
    .translate([0, 0])
    .scale(1)
    .scaleExtent([1, 8])
    .on("zoom", zoomed);

var path = d3.geo.path()
    .projection(projection);

var svg = d3.select("body").append("svg")
    .attr("width", width)
    .attr("height", height)
    .on('click', stopevents, true);

var g = svg.append("g");

g.append("rect")
    .attr("class", "background")
    .attr("width", width)
    .attr("height", height)
    .on("click", resetZoom);

svg
    .call(zoom)
    .call(zoom.event);

var tooltip = d3.select("body").append("div").attr("class", "tooltip");

d3.json("zup.json", function (error, topology) {
  g.selectAll("path")
      .data(topology.features)
      .enter()
      .append("path")
      .attr("class", function(d) { return "zup zup" + d.properties.SIFRA; })
      .on('click', zoomToClick)
      .on("mouseover", function(d) {
        tooltip.html(d.properties.NAZIV);
      })
      .on("mouseout", function(d) {
        tooltip.html("");
      })
      .attr("d", path);
});

function zoomed() {
  g.attr('transform', 'translate(' + d3.event.translate + ')scale(' + d3.event.scale + ')');
}
function zoomToClick(d) {
  if (active.node() === this) return resetZoom();
  active.classed("active", false);
  active = d3.select(this).classed("active", true);

  var bounds = path.bounds(d),
      dx = bounds[1][0] - bounds[0][0],
      dy = bounds[1][1] - bounds[0][1],
      x = (bounds[0][0] + bounds[1][0]) / 2,
      y = (bounds[0][1] + bounds[1][1]) / 2,
      scale = .9 / Math.max(dx / width, dy / height),
      translate = [width / 2 - scale * x, height / 2 - scale * y];

  svg.transition()
      .duration(750)
      .call(zoom.translate(translate).scale(scale).event);
}
function resetZoom() {
  active.classed("active", false);
  active = d3.select(null);

  svg.transition()
      .duration(750)
      .call(zoom.translate([0, 0]).scale(1).event);
}
function stopevents() {
  if (d3.event.defaultPrevented) { d3.event.stopPropagation(); }
}
</script>
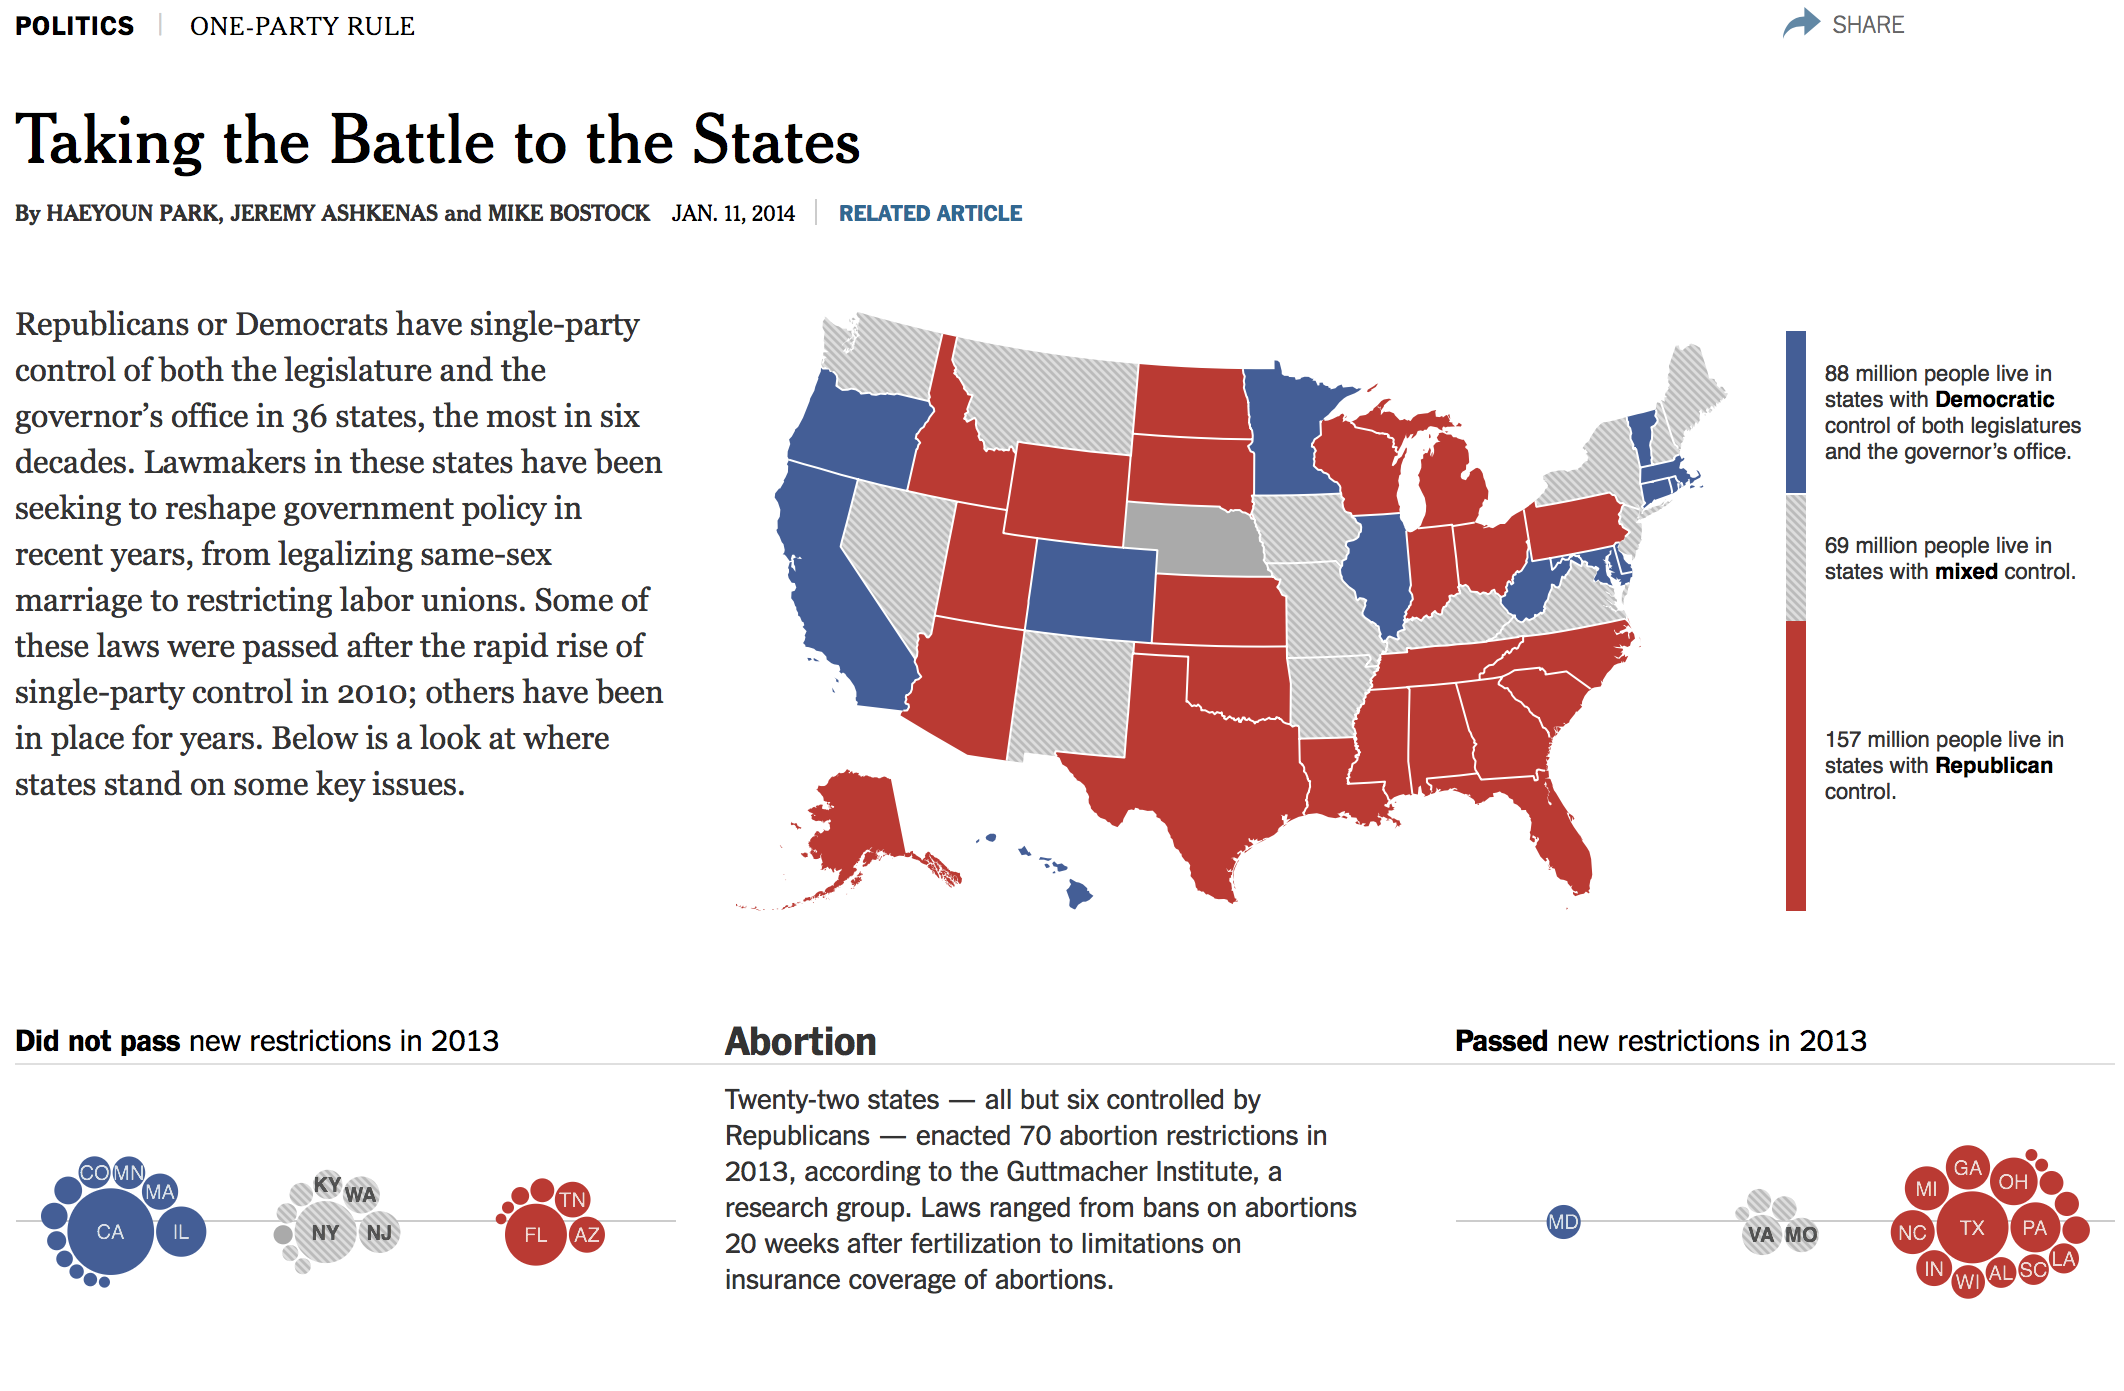
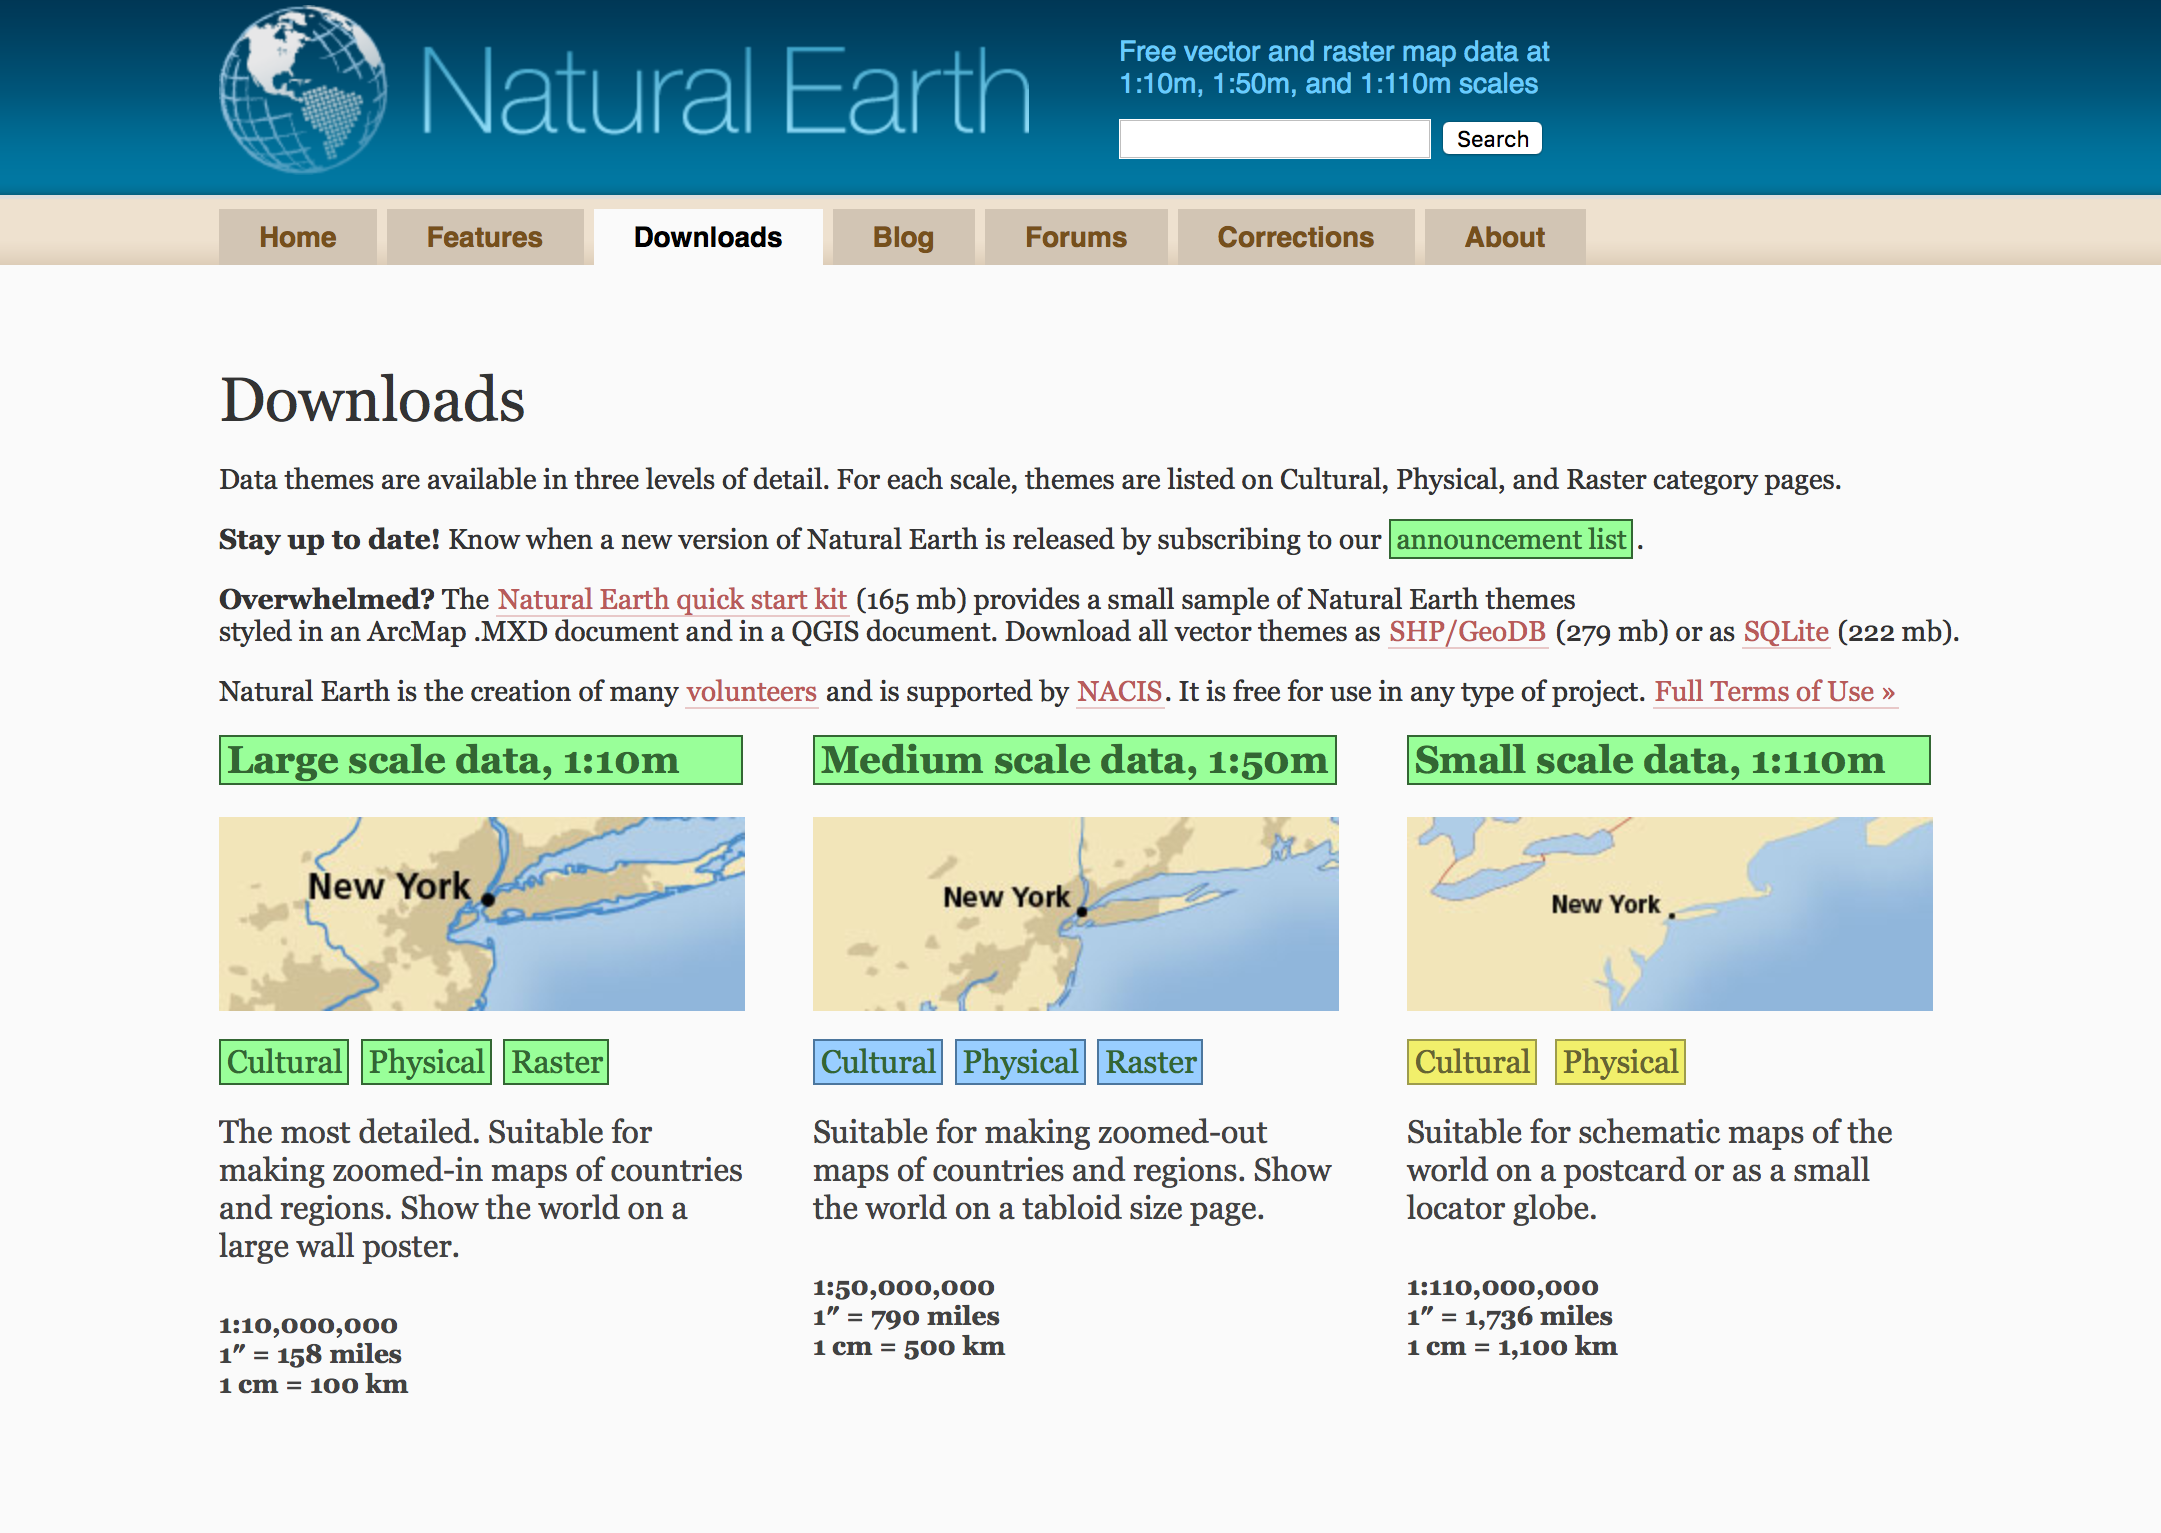
More D3.js Map Examples
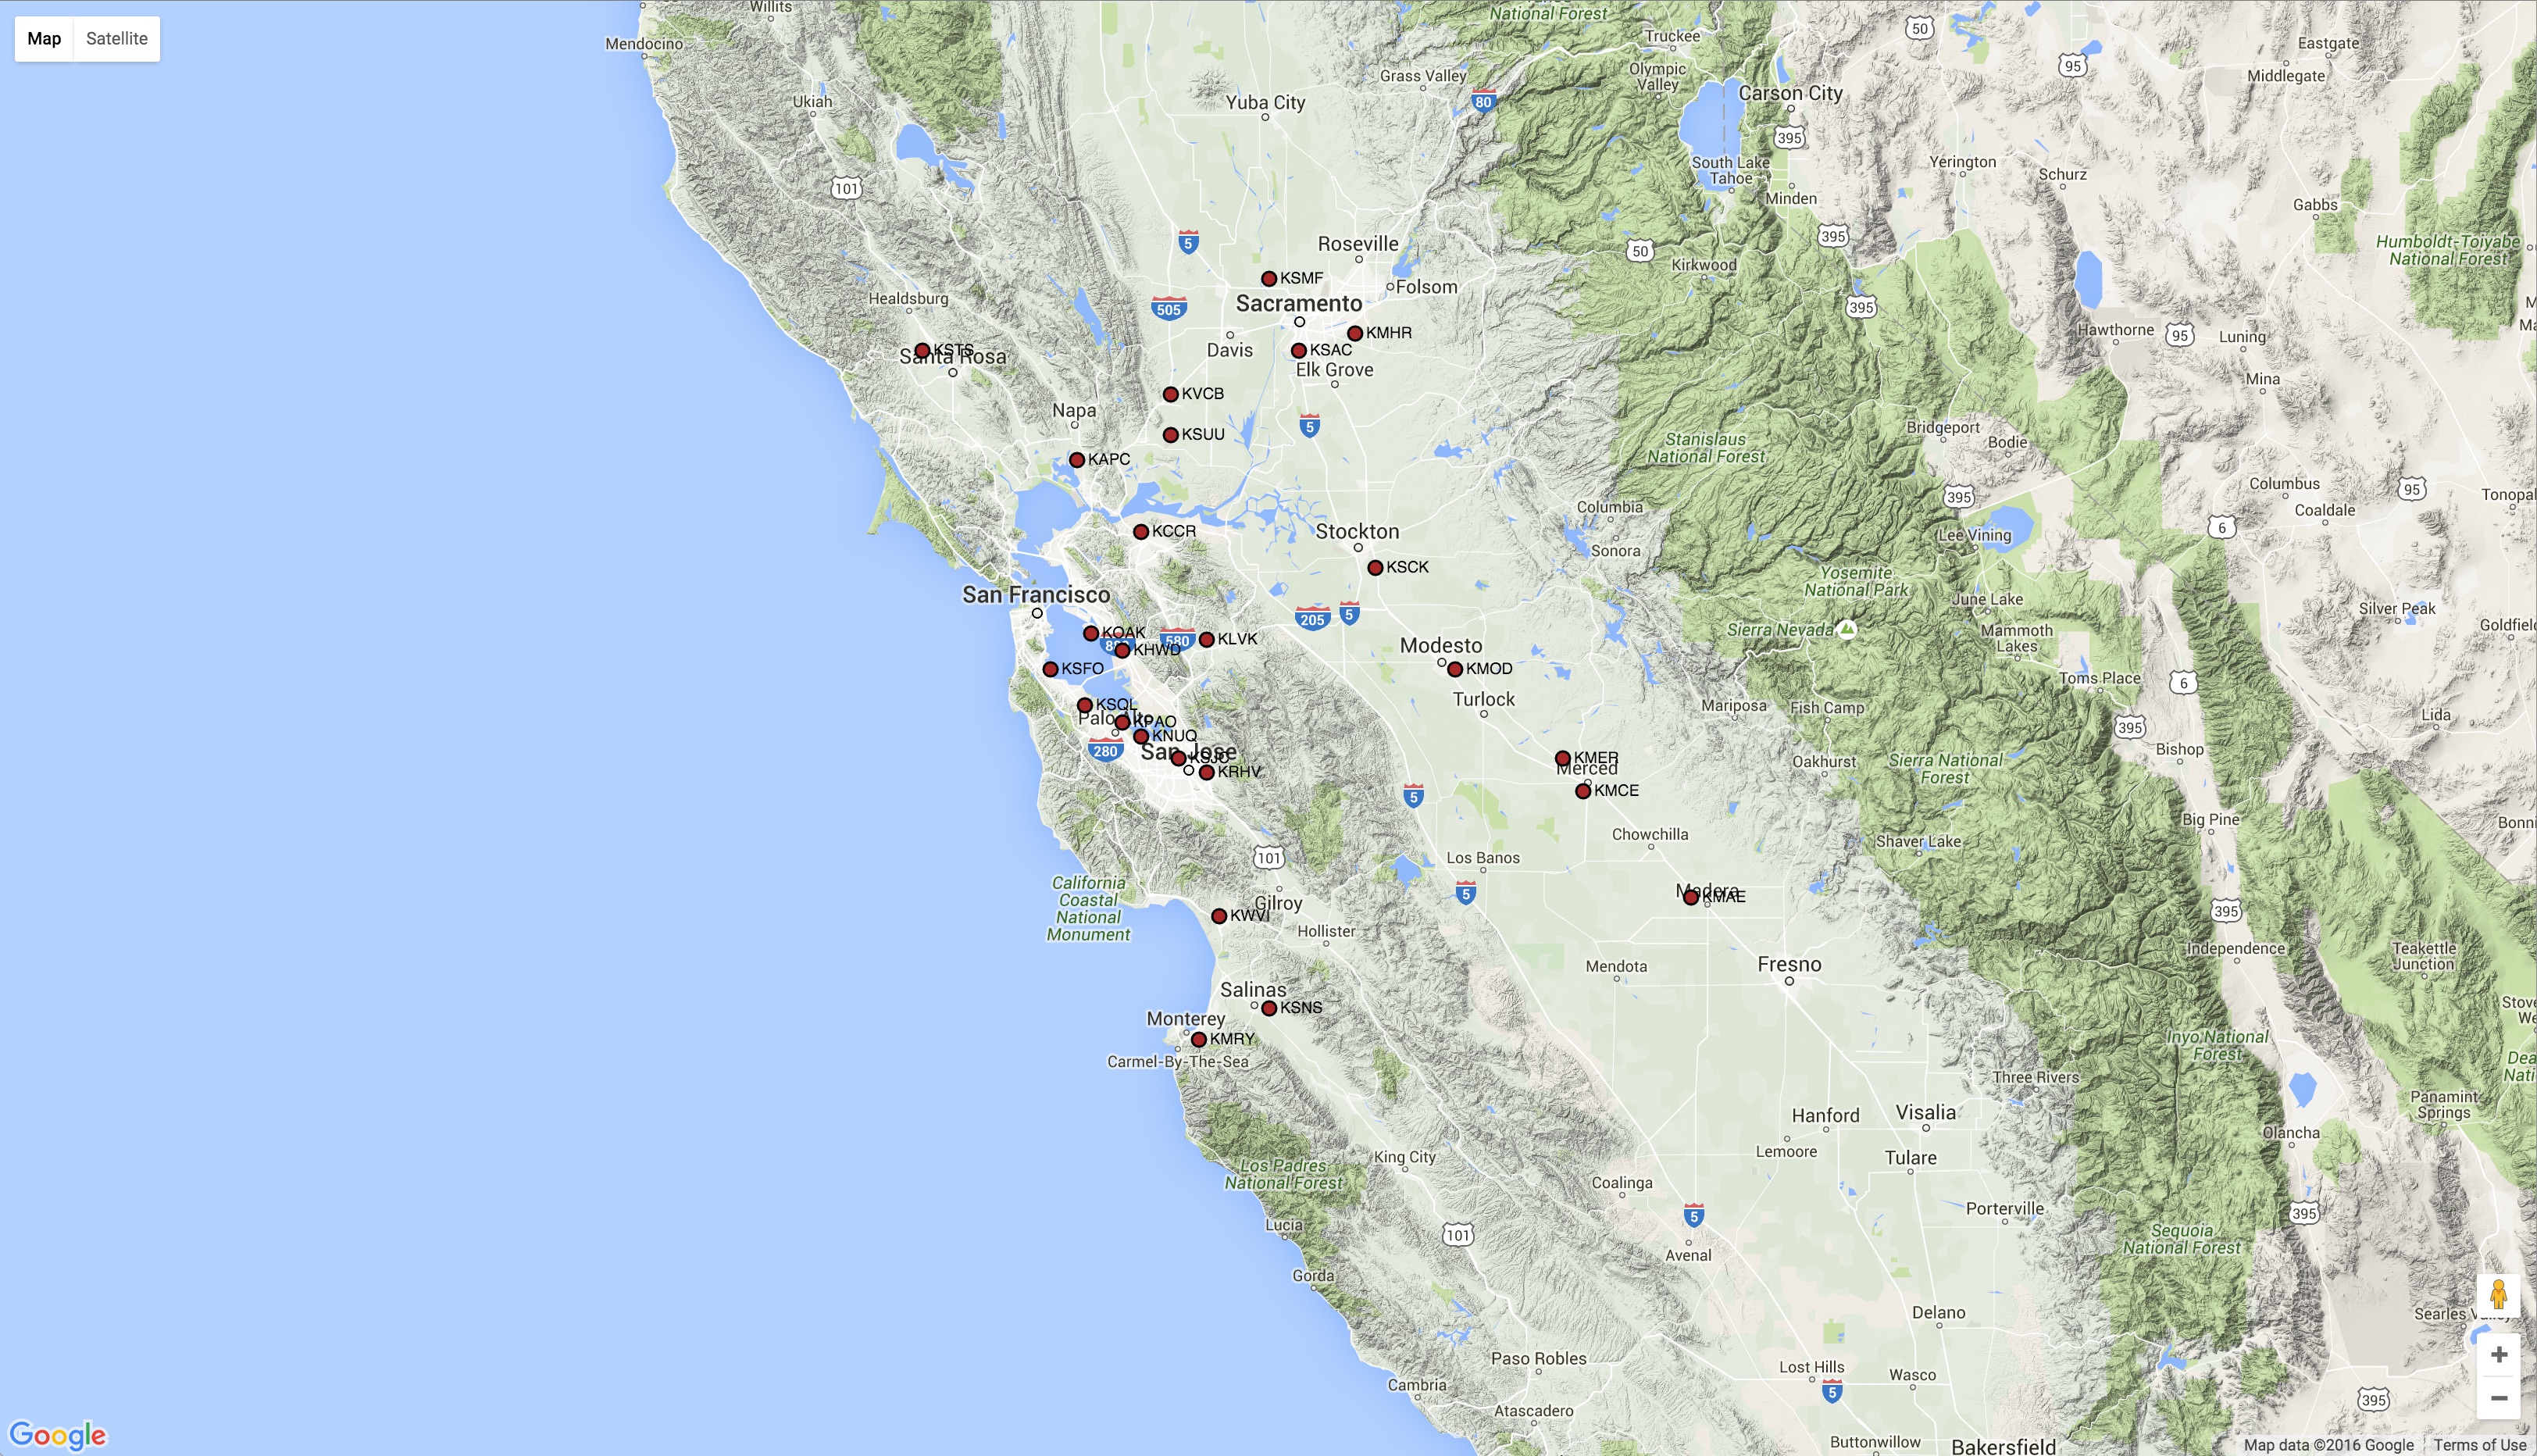
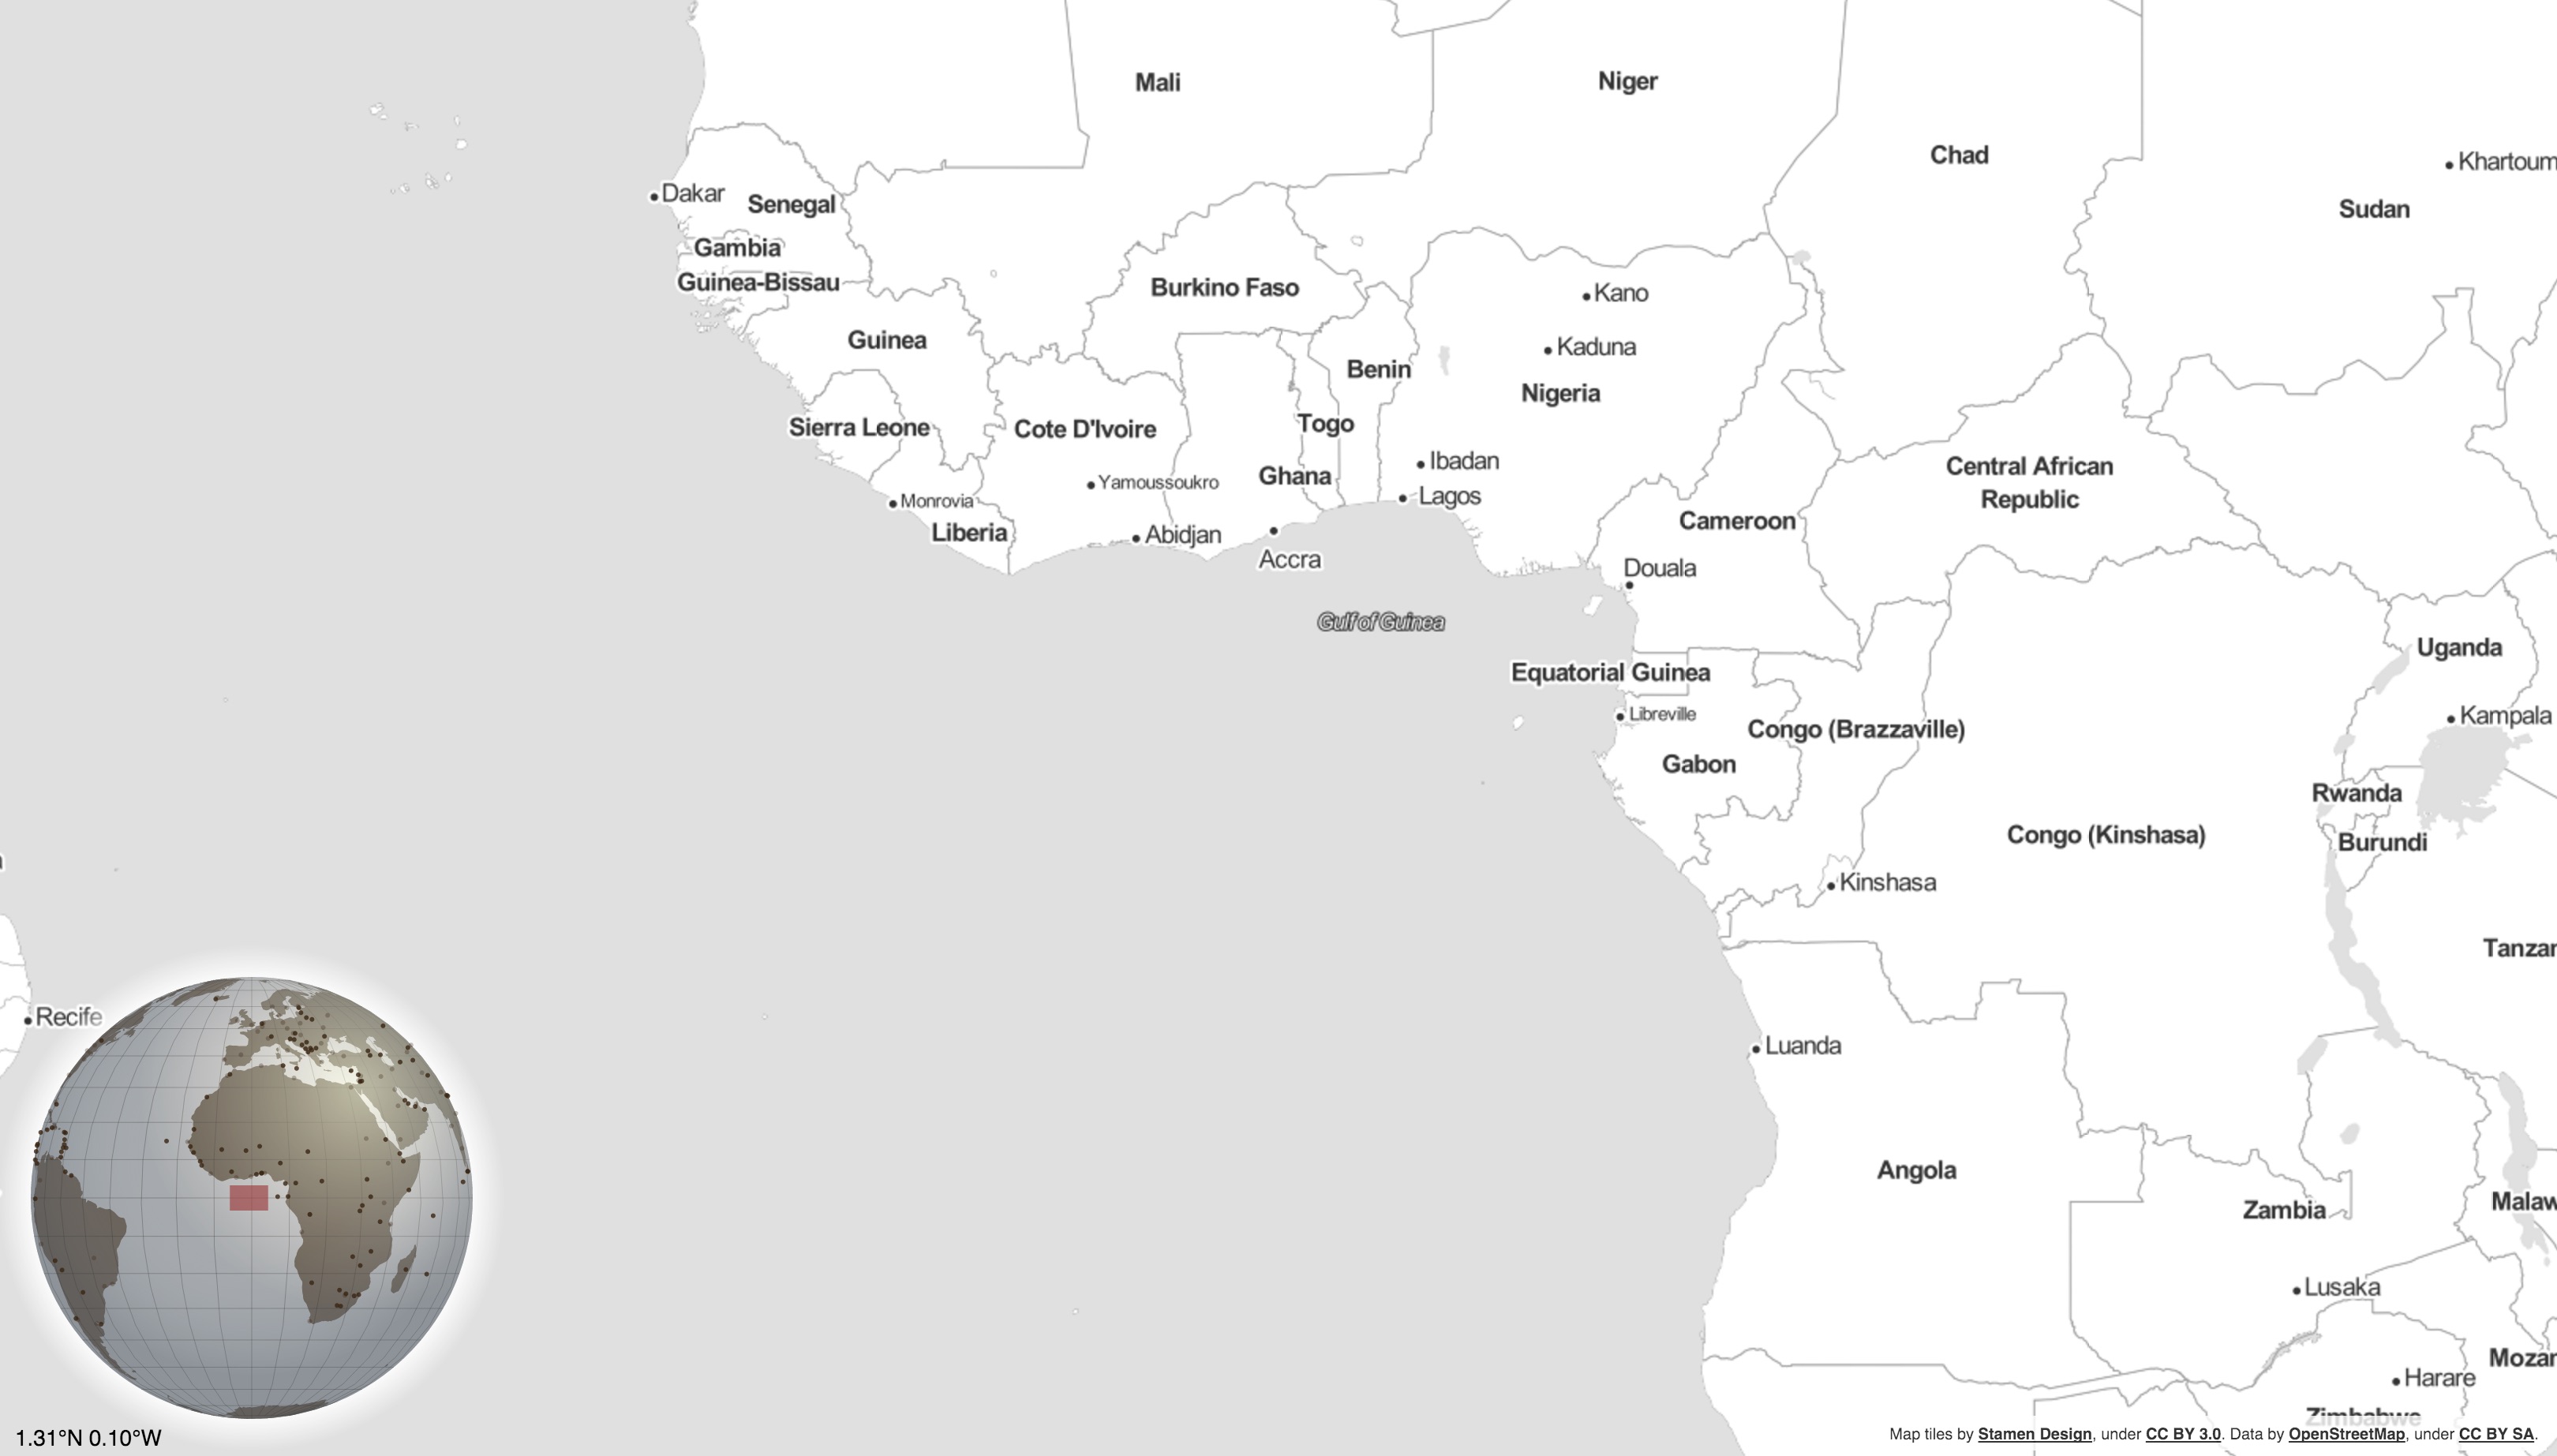
D3.js + Custom slippy map solution
In the end ...
Vector Manipulation on the Fly